Preamble
In October 2019 I joined the Splunk Global Security organization to build Splunk’s internal threat hunting program. Over a few months we went from an organization with no defined hunting program to one that can do full-scale, high-value hunting. This post describes the metrics used to evaluate a hunting program.
Measuring Success
Before we operationalized our hunting program, I knew that metrics tracking needed to be a part of everything we did. Metrics are essential for describing the performance and success of any program or team; they’re extra crucial for hunting programs because threat hunting is often misunderstood even among practiced cybersecurity operators. We needed to answer the question, “What does a successful hunting program look like, and what metrics properly describe that success?”
Defining Success
Before we could measure our program, we first had to determine what a successful program is. Our program has a few core principles that we think makes us successful:
- Hunting is intelligence-driven.
- Hunting focuses on what we can’t detect and produces new detections.
- Hunting is an activity that the entire team (e.g., non-hunters) can participate in.
As long as our operations align with these principles, then we’re setting ourselves, the organization, and the business up for success. It’s worth mentioning that these principles may not align with every hunting program, cybersecurity organization, or business model. For example, an enterprise hunting program will get a higher return on investment (ROI) by focusing on producing new detections; in contrast, an MSSP hunting program will likely get higher ROI by focusing on identifying new incidents for their customers. To some, this distinction may seem meaningless, but it has a significant impact on operations and how leadership judges the value of the program.
Defining Metrics
With our principles in mind, we needed our metrics to address two needs:
- Provide the program with data-driven feedback about what is working and not working.
- Share our success and struggles with the team, organization, and leaders.
We used these needs to create operational metrics (OMs) and key performance indicators (KPIs); OMs are used to keep the program on track while KPIs describe our success or struggle.
These are the OMs we measure:
- Number of Requested / Submitted Hunts.
- Number of Backlogged Hunts.
- Number of Completed Hunts.
- Completed Hunts Mapped to the Business Environment (corporate, cloud, etc.).
- Completed Hunts Mapped to the Kill Chain.
- Number of Discovered Hunt Findings.
- Hunt Findings Mapped to Utilized Datasets (network, host, etc.).
- Hunt Findings Mapped to Utilized Techniques (searching, frequency analysis, visualizations, etc.).
- Hunt Findings Mapped to the Type of Finding (detection, security event, risk, etc.).
- Hunt Findings Mapped to the Team Impacted by the Finding.
- Hours Taken to Complete a Hunt Task.
These OMs are continuously updated in real-time through automation and are accessible by everyone in the organization (including leaders).
As the hunting program lead, these OMs help me in two areas:
- They ensure that the program is staying true to our principles and mission.
- They help identify bias in our program and allow us to question why our operations are producing specific outcomes.
These are the KPIs we measure (consider their relevance to our core principles):
- Number of Reported Hunt Findings (detections tracked as KPI).
- Completed Hunts Mapped to the ATT&CK framework.
- Percentage of Non-Hunters Participating in Hunts.
The main thing to take away from our KPIs is that we keep them light: we only care about measuring our success against our core principles and mission. It doesn’t matter how many hunts we complete as long as we are producing relevant, impactful findings; it doesn’t matter how people hunt as long as they are participating and improving their analytical skills.
Similar to OMs, these are continuously updated in real-time and are accessible by everyone. Notably, we do not track a KPI related to intelligence-driven hunts; when we started the program we had a metric that described this, but quickly found that it wasn’t worth the overhead of tracking because we were always performing intelligence-driven hunts.
Making Metrics Accessible
Earlier I said that everyone could see our metrics, so I thought that I should share a heavily redacted version of our metrics dashboards. The screenshot below shows our “thousand-foot view” of the hunting program; it contains the majority of our OMs and KPIs:
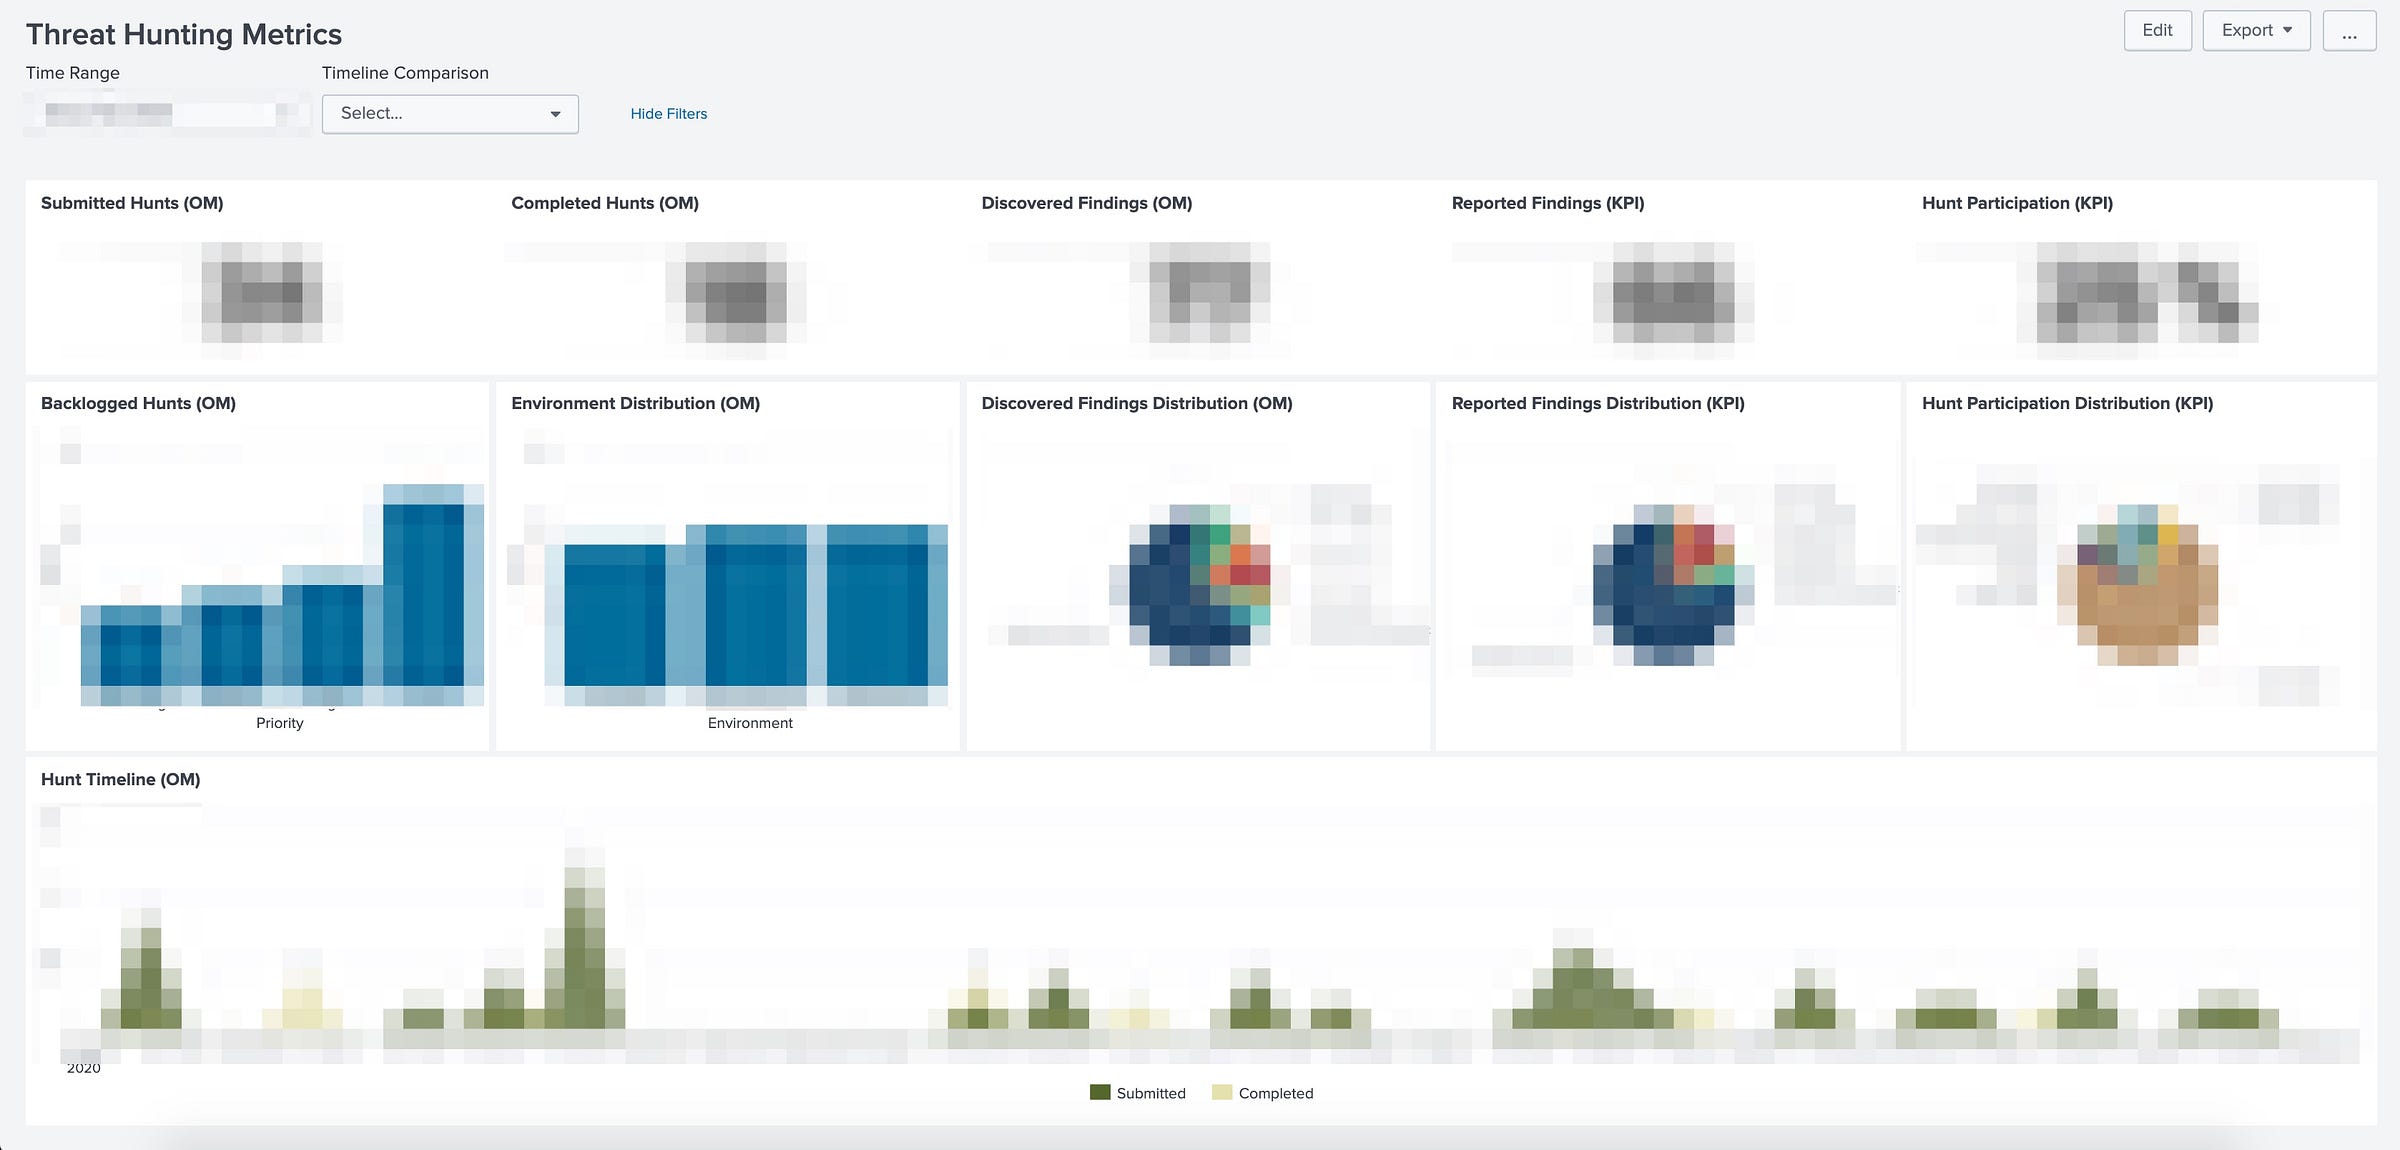
We clearly label our OMs and KPIs on the dashboard and use a combination of total counts, bar charts, pie graphs, and line charts to describe the status of our program at any given time. These OMs are dynamically viewable over any time range (day-to-day, week-to-week, month-to-month), making it easy to view long-term trends. As the program lead, I regularly use this dashboard to do the following:
- Get a sense of how large our backlog is.
- “Do we need to call in assistance from the team?”
- Check where in our environment we’re hunting.
- “Are we biased toward one environment and do we need to balance our focus?”
- See what we’re finding but not reporting.
- “Do we not have the right processes in place to make certain findings actionable?”
- Track which TTPs we’re focused on hunting
- “Are we skewed toward a particular set of tactics?”
This next screenshot is a bit more complicated, but is valuable for identifying what we’re finding, how we’re finding it, and who is impacted by our findings:
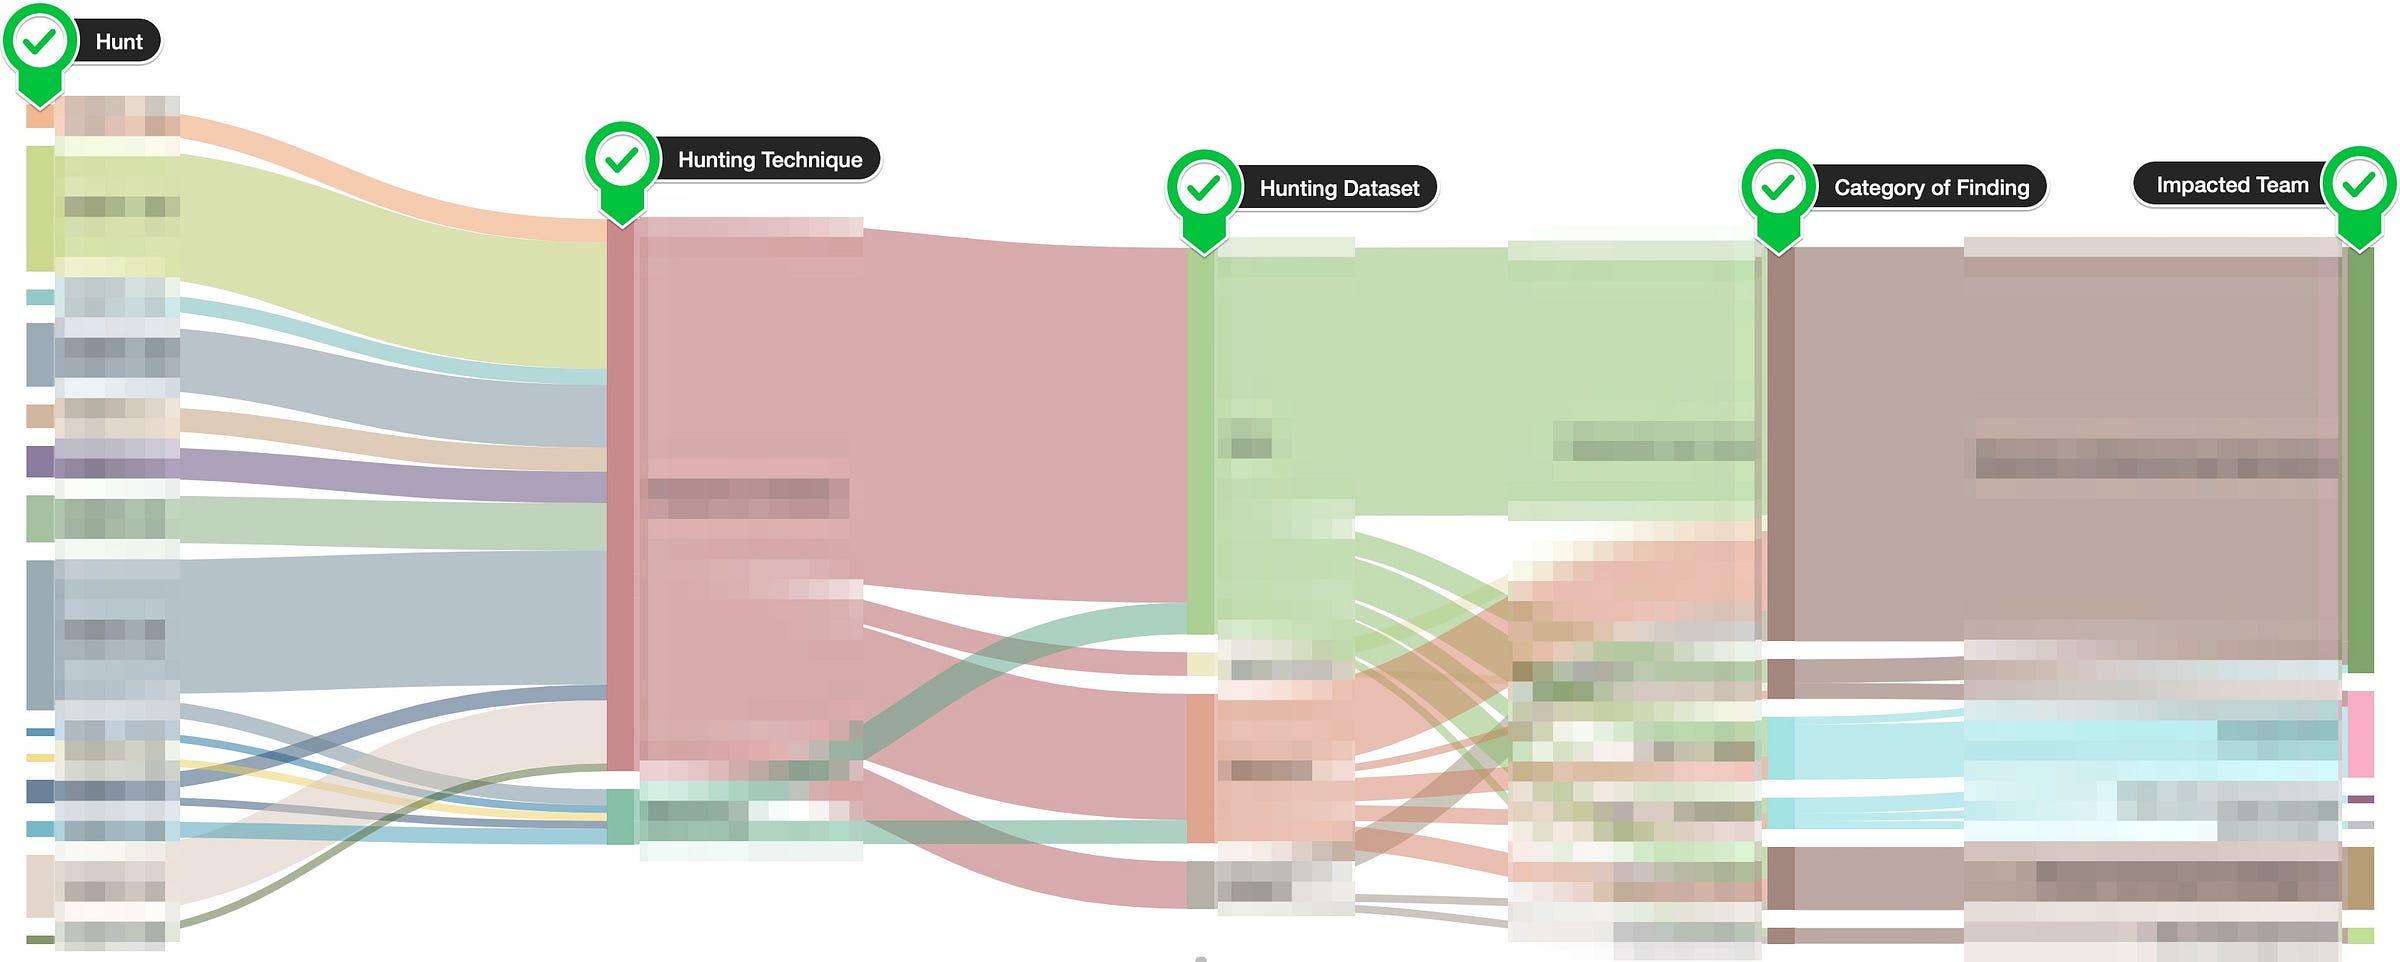
This Sankey diagram is our “flow” of all individual hunt findings (behind the scenes, a detailed spreadsheet powers the diagram). It follows this path, from left to right:
- Hunt that produced the finding.
- Technique that identified the finding (searching, freq. analysis, visualizations, linked data graphs, machine learning).
- Dataset that contained the finding (network, host, file, cloud, application).
- Category or type of finding (detection, security event/incident, IT/biz risk, hunt, data/process gap).
- Team impacted by the finding.
As the program lead, I use this in a few ways:
- Identifying which hunts produced a significant or insignificant number of findings
- “What went so right / wrong with hunt X?”
- Identifying bias in our hunting techniques
- “Is frequency analysis super effective or are we just using it more than other techniques?”
- Identifying bias in our hunting datasets
- “Why aren’t we utilizing dataset Y more often?”
- Understanding who our core partners are (in this screenshot, one team receives more than half of our findings)
While I don’t think every hunting program requires this level of detail, I’ve found it valuable.
If you lead a hunting program and aren’t using metrics to measure the program’s performance, then I recommend you focus on that sooner rather than later. If you are thinking of starting a hunting program, then you should seriously consider dedicating time early in the program’s life (pre-operations) to define its success criteria and metrics.